prometheus 설치 + grafana 연동
CentOS7에서 구축하였으며
Prometheus + grafana 서버 1대 / 모니터링 대상 서버 1대로 구성하였습니다.
Prometheus 설치
https://prometheus.io/download/
Download | Prometheus
An open-source monitoring system with a dimensional data model, flexible query language, efficient time series database and modern alerting approach.
prometheus.io
홈페이지에서 파일 다운로드 가능합니다.

os에 맞게 파일을 다운받아 서버에 설치합니다.
| 유저 추가 useradd -m -s /bin/bash prometheus su - prometheus |
| 다운로드 cd /home/prometheus wgethttps://github.com/prometheus/prometheus/releases/download/v2.34.0/prometheus-2.34.0.linux-amd64.tar.gz tar -xzvf prometheus-2.34.0.linux-amd64.tar.gz |
| 폴더명 변경 로그아웃 mv prometheus-2.34.0.linux-amd64/ prometheus exit |
| 시스템 서비스 등록 vi /etc/systemd/system/prometheus.service [Unit] Description=Prometheus Server Documentation=https://prometheus.io/docs/introduction/overview/ After=network-online.target [Service] User=prometheus Restart=on-failure ExecStart=/home/prometheus/prometheus/prometheus \ --config.file=/home/prometheus/prometheus/prometheus.yml \ --storage.tsdb.path=/home/prometheus/prometheus/data [Install] WantedBy=multi-user.target |
| 서비스 실행 systemctl daemon-reload systemctl start prometheus systemctl status prometheus systemctl enable prometheus * TCP/9090 포트 open |
Node Exporter 설치 (Prometheus 서버와 모니터링 서버 둘 다 설치)
| 유저 추가 useradd -m -s /bin/bash prometheus su - prometheus |
| 다운로드 cd /home/prometheus wget https://github.com/prometheus/node_exporter/releases/download/v1.0.1/node_exporter-1.0.1.linux-amd64.tar.gz tar -xzvf node_exporter-1.0.1.linux-amd64.tar.gz |
| 폴더명 변경 로그아웃 mv node_exporter-1.0.1.linux-amd64/ node_exporter exit |
| 서비스 작성 vi /etc/systemd/system/node_exporter.service [Unit] Description=Prometheus Node Exporter Documentation=https://prometheus.io/docs/guides/node-exporter/ Wants=network-online.target After=network-online.target [Service] User=prometheus Restart=on-failure ExecStart=/home/prometheus/node_exporter/node_exporter [Install] WantedBy=multi-user.target |
| 서비스 실행 systemctl daemon-reload systemctl start node_exporter systemctl status node_exporter systemctl enable node_exporter * TCP/9100 포트 Open |
Prometheus 와 Node exporter 연동
| Prometheus 설치 된 서버에서 진행 * 설정 파일 수정 시 간격(띄어쓰기)로 인해 error가 생길 수 있음. 원본 내용 복사해서 수정하는게 좋음 |
| cd /home/prometheus/prometheus vi prometheus.yml # scrape_configs: 밑에 아래 추가 - job_name: '원하는 이름 설정' static_configs: - targets: ['localhost:9100'] > 모니터링 대상 ip 지정 - job_name: '원하는 이름 설정' static_configs: - targets: ['ip:9100'] > 모니터링 대상 ip 지정 |
| Prometheus 재시작 (설정 파일 수정 후엔 재시작을 해줘야 함) systemctl restart prometheus systemctl status prometheus |
Grafana 연동 (Prometheus 서버에 설치)
https://grafana.com/grafana/download
Download Grafana
Overview of how to download and install different versions of Grafana on different operating systems.
grafana.com

OS에 맞게 grafana를 설치 합니다. 홈페이지 상에 나온 명령어를 그대로 입력하면 됩니다.
| Grafana 설치 wget https://dl.grafana.com/enterprise/release/grafana-enterprise-8.4.4-1.x86_64.rpm sudo yum install -y grafana-enterprise-8.4.4-1.x86_64.rpm |
| 서비스 실행 systemctl daemon-reload systemctl start grafana-server systemctl status grafana-server systemctl enable grafana-server * TCP/3000 포트 Open |
| Grafana 접속 http://[서버ip]:3000 초기 ip/pw는 "admin" / "admin" 이다. |

Dash Board 추가하기
- 원하는대로 커스텀하여 사용할 수 있지만 https://grafana.com/grafana/dashboards/ 사람들이 만들어 놓은 Dash Board를 가져올 수 도 있다. 해당 방법에 대해 알아보자
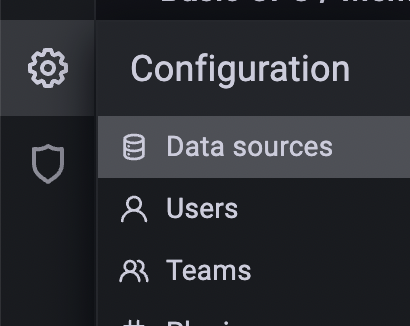
로그인 후 왼쪽 메뉴에서 Configuration -> Data sources 로 이동한다.
Prometheus 검색 후 추가

왼쪽 메뉴에서 Create -> Import 클릭


필자는 아래 두 Dash Board를 썼다. 아래 빨간 표시의 'copy id to clipboard'를 클릭해 위 빨간 표시 부분에 붙여넣고 'Load' 하면 된다.
| https://grafana.com/grafana/dashboards/11074 |
| https://grafana.com/grafana/dashboards/1860 |

각 적용 후 Dash Board 화면


여기서 마치고, 다음엔 알람 받는 법을 알아보자